A global automotive company approached us to redesign its spare parts distribution network challenging us to optimize Total Cost to Serve as well as Total CO2 Footprint of the network from the part sources all the way to the consumers. The network was enormous. We needed a new way of handling this scale.
In this article, we will share two innovative approaches leveraged with the power of data analytics and AI-based algorithms. These approaches make possible some of the “difficult or nearly impossible” challenges in network design.
1: Identifying Realistic Candidate Locations using AI
The client asked for a Greenfield scenario and wanted to see how far the current network is from the efficient frontier. Due to the size of the network, we needed to go beyond the classical p-median approach and account for such parameters as “maximum time/distance from a warehouse to a parts consumer,” “min/max volume in m2 and m3 for SMALL, MEDIUM, LARGE and XLARGE warehouses” and “min/max demand coverage for each warehouse.” Furthermore, the candidate location would have to be on a major road, preferably a commercial zone suitable for a logistics hub.
We developed a hybrid heuristic that used k-means clustering and AI-based Genetic Algorithms to develop candidate locations with the right size and reach (i.e., within min/max capacity and demand coverage constraints), and further processed the candidate locations to “pull” them to nearby suitable commercial locations.
This approach greatly enhanced the quality of the candidate list that went into our MILP-based (mixed-integer linear program) solver to create the optimal network.
2: Demand Profiling using Demographic Data
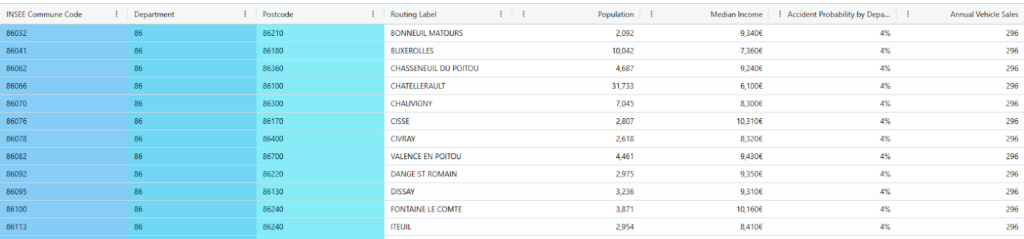
The client was concerned with the future demand pattern changes in the automobile spare parts industry and needed a solution to proactively take this into account.We resolved these challenges by obtaining the transaction-level historical data from the company and demographic data from the national institutes of the relevant countries–including traffic accident data, population density and household income.
Using these datasets, we created a normalized demand by zip code that represented the future demand for spare parts much better. This innovation allowed us to create and compare scenarios (for both smart candidate selection and the optimal network), demonstrating the power of data-driven insights when processed correctly.

These innovations, supported by Solvoyo’s state-of-the-art scenario management platform, allowed the client to review tens of scenarios, choose a very realistic strategy that promised significant cost and CO2 savings, implement the results and obtain measurable value. The project’s accomplishments such as 11 million Euros of savings while meeting stringent service level targets and 88-93% reduction in the outbound CO2 footprint were featured on Forbes.

Stay tuned for the next part for us to share details on other network strategy innovations in our upcoming articles.